Jeremy, age 46, engaged me in July 2025 as a running coach to take him through to the Frankfurt Marathon at the end of October. At the time he was running 10-15 miles per week and was looking to complete Frankfurt in under 4 hours 30 minutes. He also had good base fitness in other areas such as walking, yoga and tennis.
TRAINING PHASE
With 12 and a half weeks to play with for a marathon-specific phase of training, we got to work straight away, starting with a lactic threshold test, which was a great way to assess Jeremy’s current level of fitness and to establish his training heart rate zones (more on that shortly).
The training schedule was structured into 3 blocks of 4 weeks. The training load and intensity would progressively increase over the first 3 weeks of a block, with week 4 used as a lower intensity ‘recovery’ week before moving into the next block of incrementally harder training.
The chart below shows Jeremy’s weekly mileage, with the 3 progressive weeks followed by a recovery week clearly visible in 4 blocks. The lighter blue indicates planned distance with the darker blue indicating actual mileage, a clear indicator of Jeremy’s commitment and adherence to his training plan. The rare sections of grey indicate planned distance that was not completed.
The typical structure of a week consisted of a progressively longer run at the weekend, with a couple of steady runs and a higher intensity speed or intervals session during the week. To keep the training fresh, the nature of the high intensity session varied week-by-week e.g. minute on/minute off reps, time trials, progression runs where the pace increases or decreases mile-by-mile. We also worked with fartlek runs where Jeremy could decide on and vary his pace during the training run as he felt, particularly useful after a long session.
For his steady runs, Jeremy would run largely in heart rate zones 2 & the lower end of zone 3 (as determined from the threshold test), enabling him to handle the increased training distances without excessive intensity. Jeremy’s longest training run was a 21-miler 3 weeks before Frankfurt.
Here we can see the longest distance that Jeremy covered each week in a single session, with a nice consistent gain meaning that there were no overly excessive incremental steps, reducing the risk of injury and overload.
This was all designed to fit in with Jeremy’s work and family commitments, with adjustments made as required each week. Jeremy’s performances and feedback during a week were also taken into account for the next week’s training schedule.
We had check-ins every two weeks, where we would review recent sessions and look ahead to the following two weeks. We also took the opportunity to cover a variety of other topics such as fuelling and hydration plans, and a race strategy for Frankfurt.
In the 2 weeks leading up to the race, Jeremy went through a taper phase with a steady reduction in intensity and distance. This fitted into the 13-week structure well as we could use the recovery week from training block 3 coupled with week 13.
The next chart shown below is an interesting one and requires a little explanation. Let’s focus on a couple of metrics:
-
The blue line indicates Jeremy’s Fitness or Chronic Training Load (CTL) level, which provides a 6-week view of the training volume that Jeremy undertook. The desirable (and actual) trend is for this to move steadily upwards during the training cycle. Jeremy achieved a continuous Fitness improvement week-on-week within safe parameters. The taper phase is also noticeable as the blue line drops nicely in the lead up to the race, followed by a spike from the marathon.
-
The yellow line indicates Jeremy’s Form. If Form is going up, the athlete is training less and recovering, if going down, the athlete is training more and overloading. For fitness gains, the Form value needs to be in negative territory, but if it drops too low then the risk of burnout and injury increases. We monitored this on a weekly basis to ensure that Jeremy stayed in safe territory. You’ll see that during the taper phase, the Form rose, bringing Jeremy back up to a Form level or around +20 by race day, a perfect place to be when taking on a marathon. Note the big drop in Form as a result of race day at the far right of the chart!
For completeness, the other elements shown on the chart are as follows:
-
The pink line indicates the level of Fatigue, and works largely in the opposite direction to the yellow Form line.
-
A red dot is shown for each individual workout, and indicates the Training Stress Score (TSS). TSS is a measure of the effort involved in the session, factoring in both duration and intensity. The weekly long runs stand out, with race day unsurprisingly being the most extreme.
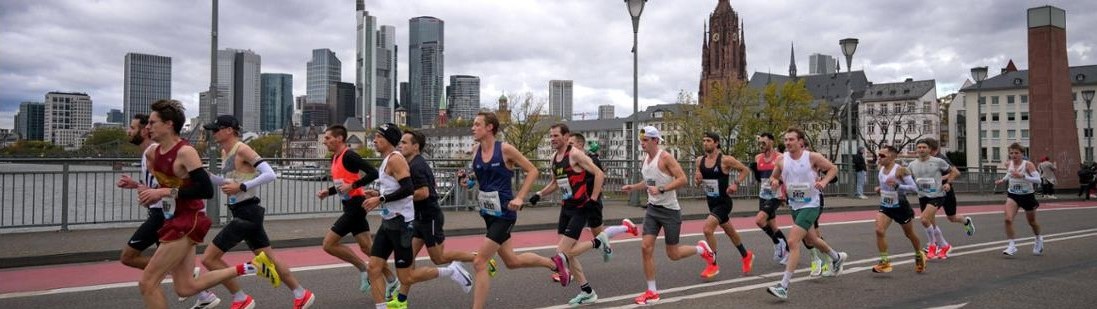
RACE DAY
Come race day, Jeremy produced a fantastic performance, maintaining a largely steady pace to clock 4 hours 18 minutes, a result Jeremy was very happy with.
The chart below shows a number of metrics from the race, namely:
-
Course elevation (in grey). Frankfurt is a relatively flat course with overall elevation of 348 feet/106 metres.
-
Heart rate (in red). After the first mile and a half, Jeremy’s heart rate stayed largely steady throughout, with an understandable slight drift upwards towards the end as he squeezed out every ounce of remaining energy!
-
Pace (in green). Jeremy’s pace was largely consistent over the first 20 miles. The next few miles saw a slight drop, some of which was due to elevation spikes and brief refuelling stops, along with the odd brief walk to stretch off a tight left hip. But note the significant rise in pace over the last couple of miles, an indicator of Jeremy’s stamina levels that he had built over the preceding 12 weeks.
Overall, both athlete and coach were very satisfied with the outcome.